Have you ever wondered how India’s leading stock index can inspire better project management strategies? The Nifty 50 isn’t just a benchmark for the stock exchange—it’s a blueprint for efficiency, adaptability, and structured growth.
Since 1996, the Nifty 50 has tracked the top 50 stocks across 13 sectors, representing over 60% of the National Stock Exchange‘s free-float market cap. Its semi-annual rebalancing ensures only the strongest performers remain, mirroring how successful teams prioritize high-impact tasks.
For investors and managers alike, this index reflects India’s economic health while offering lessons in scalability. Could its principles streamline your workflow?
Key Takeaways
- The Nifty 50 covers 13 key sectors, making it a diverse market indicator.
- It represents over 60% of the National Stock Exchange’s free-float market cap.
- Rebalanced semi-annually to maintain performance standards.
- Widely tracked by international investors and ETFs.
- Serves as a real-time snapshot of India’s economic growth.
What Is the Nifty 50 Index?
Born from economic reforms, this benchmark index revolutionized how we measure Indian market performance. Launched in April 1996 with a base value of 1,000 points, it tracks 50 large-cap stocks across 13 sectors on the National Stock Exchange. The index reflects about 60% of India’s equity market capitalization.

The Foundation of India’s Stock Market
The nifty index emerged during India’s economic liberalization era, creating a transparent benchmark for investors. Adopting free-float methodology in 2009 improved accuracy by counting only tradable shares. Strict liquidity rules require constituents to maintain an impact cost below 0.50%.
Financial institutions dominate the index, with financial services accounting for 32.76% of its weight. This mirrors India’s bank-driven economy where credit growth fuels expansion. Like the S&P 500 tracks US markets, Nifty serves as India’s premier economic barometer.
How Nifty 50 Represents the Indian Economy
Movement in the National Stock Exchange‘s flagship index often predicts GDP trends. The semi-annual rebalancing ensures only companies meeting strict criteria remain listed. Over 20 international ETFs track these stocks, linking India to global capital flows.
Free float market capitalization weighting gives greater influence to widely held companies. This method prevents distortion from promoter-held shares. The result is a true snapshot of India’s corporate health, trusted by fund managers worldwide.
Nifty 50 Composition and Methodology
The Nifty 50’s structure offers a clear view of India’s economic drivers through its sector allocations. Its methodology ensures only liquid, high-performing stocks influence the index, mirroring market trends.
Sector Weightings and Key Industries
Financial services dominate with 32.76% weight, reflecting India’s bank-led economy. IT follows at 13.76%, while oil/gas and consumer goods hold 12.12% and 8.46% respectively.
Top companies like Reliance, HDFC Bank, and TCS drive performance. Their market capitalization ensures stability, much like blue-chip stocks in global indices.
Selection Criteria for Index Inclusion
To qualify, stocks must trade for six months and meet liquidity thresholds. Futures and options eligibility is mandatory, filtering for high-volume traders.
Quarterly reviews replace underperformers. Adani Enterprises joined in 2022, showing how the index adapts to market shifts.
Free-Float Market Capitalization Explained
The index uses free float method, counting only shares available for trading. This avoids distortion from promoter-held stakes.
Full market capitalization includes locked-in shares, but free float better reflects real investor impact. It’s why widely held firms weigh more.
Historical Performance of Nifty
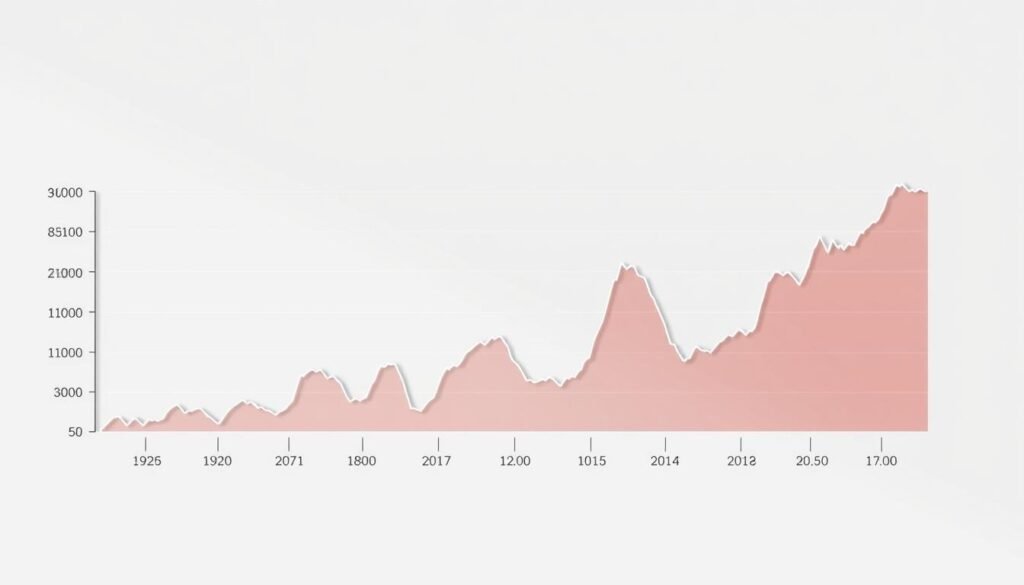
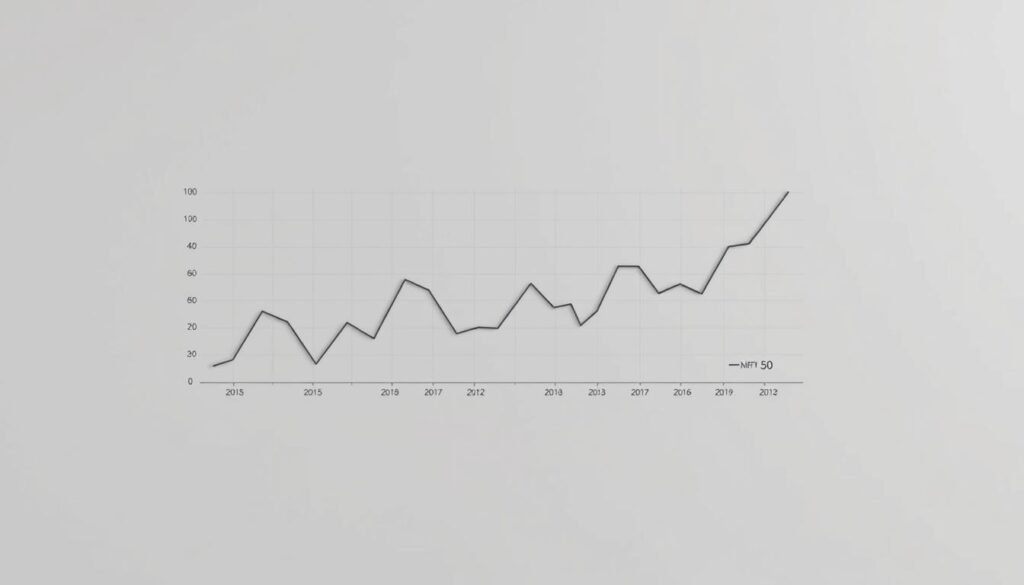
Tracking the Nifty 50’s historical performance reveals key economic turning points in India’s financial landscape. From record highs to sharp corrections, its data reflects how global and domestic events shape market trends.
Major Milestones in Nifty’s Journey
The index first crossed 10,000 points in 2017, signaling India’s economic acceleration. By September 2024, it hit an all-time high of 26,277 points, driven by sectoral diversification and foreign investments.

Notable Market Crashes and Rallies
In 2004, election uncertainty triggered a 12.24% single-day crash. The 2008 global crisis saw a 52% annual drop, while the 2020 COVID crash included a -12.98% plunge. Recovery was swift—2009 delivered 75.76% gains.
Annual Returns Since 2000
Long-term data shows a 14.5% CAGR since inception. Recent yearly returns include +20.03% (2023) and 7.70% YTD growth. The index outperformed global peers during the 2020-21 pandemic rebound.
Current Nifty 50 Statistics and Trends
Tracking current Nifty trends reveals which sectors drive India’s market momentum today. At 25,549 INR with a 1.21% daily gain, the index shows resilience amid global volatility. This value reflects collective performance across 50 blue-chip stocks that shape investment decisions.

Latest Index Value and Performance Metrics
The index gained 7.2% this month, outperforming most emerging markets. Bharti Airtel leads yearly gainers at +42.36%, while IndusInd Bank trails at -44.19%.
Maruti Suzuki hit a 52-week high at 12,715 INR, signaling auto sector strength. Institutional activity accounts for 63% of recent volumes, suggesting smart money positioning.
Top Performing Constituents
Beyond the leaderboard, Reliance Industries contributes 12.4% to index movement. The current list shows IT stocks rebounding after earnings surprises.
Three financial stocks dominate turnover, with HDFC Bank seeing record FII inflows. This data helps predict sector rotations before official rebalancing.
Sectoral Breakdown and Weightings
Financial services maintain their 32.8% stronghold, but tech weightings grew 180 basis points. Energy and consumer staples show divergent trends that may impact future value.
Analysts watch telecom’s 5.3% surge this quarter, potentially triggering index adjustments. Such shifts create opportunities for tactical portfolio realignments.
How to Invest in Nifty 50
Investors seeking exposure to India’s growth story have multiple avenues to capitalize on the Nifty 50’s performance. The index offers derivatives, international access products, and passive funds that track its movements.

Trading Nifty Futures and Options
The National Stock Exchange offers weekly and monthly contracts on Nifty stocks. Futures contracts require 10-15% margin and settle monthly, while options provide defined-risk strategies.
Popular approaches include bull call spreads during earnings season or protective puts for downside protection. Liquidity remains high, with average daily derivatives volume exceeding 2 million contracts.
GIFT Nifty for International Investors
Formerly SGX Nifty, GIFT Nifty allows 21-hour trading from Gujarat’s International Financial Tech City. This dollar-denominated contract helps global investors manage time zone differences.
Tax-efficient structures like Mauritius-domiciled funds often use this route. Settlement occurs through international clearinghouses, avoiding local Indian brokerage accounts.
Index Funds and ETFs Tracking Nifty
Passive products like iShares Nifty 50 ETF (INDY) offer low-cost exposure with expense ratios under 0.75%. Domestic mutual funds from ICICI and HDFC provide rupee-denominated options.
When comparing products, evaluate tracking error and liquidity. The top three ETFs account for 85% of the $4.2 billion invested in Nifty-linked passive vehicles globally.
Nifty 50 vs Other Indian Market Indices
India’s stock markets offer multiple indices, each serving distinct investment purposes. While the Nifty 50 tracks large-cap performance, other benchmarks provide mid-cap exposure or broader sector coverage. Understanding these differences helps investors build diversified portfolios.
Comparison with Sensex
The Sensex contains 30 companies versus Nifty’s 50, making it less diversified. Both focus on large-cap stocks, but Sensex weights constituents by market cap rather than free-float methodology.
Historical data shows 90% correlation between these indices. However, Nifty’s additional constituents provide better sector balance, particularly in financial services.
Relationship with Nifty Next 50
This index acts as a promotion zone for the main Nifty 50. It includes mid-cap stocks ranking 51-100 by market cap.
The cnx nifty methodology periodically promotes top performers from Next 50 to the main index. This creates opportunities to identify future leaders early.
How Nifty 500 Provides Broader Exposure
Covering 95% of India’s market cap, this index includes small and mid-cap stocks. It offers complete sector representation beyond large-cap dominance.
Investors use Nifty 500 ETFs for whole-market exposure. The index rebalances quarterly, adjusting for emerging trends across all market segments.
Understanding Nifty Derivatives Market
Options and futures on this major index account for nearly half of global derivatives activity. The market offers advanced trading tools that help investors manage risk and leverage opportunities in India’s growing economy.
Weekly and Monthly Options Explained
Weekly options provide short-term exposure with Friday expirations, ideal for event-driven strategies. Monthly contracts offer better liquidity for larger positions, settling on the last Thursday.
The put-call ratio (PCR) serves as a key sentiment indicator. When PCR exceeds 1.0, it suggests bearish market expectations among traders.
Risk Management Strategies
Smart traders use delta hedging to offset directional risk in their portfolios. Open interest analysis reveals where large positions accumulate, signaling potential support or resistance points.
The India VIX volatility index correlates strongly with option premiums. During high volatility periods, strategies like iron condors become particularly effective.
Market Indicators Derived from Nifty
Delivery-based trading signals help distinguish genuine accumulation from speculative activity. Expiry day price action often reveals institutional positioning through last-hour moves.
Arbitrage opportunities emerge when futures trade at significant premiums to spot prices. These gaps typically close as expiration approaches, creating mean-reversion setups.
Conclusion: Navigating the Indian Market Through Nifty 50
Global investors increasingly rely on this benchmark to gauge opportunities in South Asia’s fastest-growing economy. The nifty index reflects real-time corporate health across 13 sectors, serving as India’s economic pulse.
With potential inclusion in global indices, its influence expands beyond domestic markets. Institutional players now allocate 5-15% of emerging market portfolios to Nifty-linked instruments.
For optimal exposure, balance core holdings in financial services with tactical positions in outperforming sectors. Use derivatives for hedging during volatile quarters.
Track live data through NSE portals and Bloomberg terminals. Quarterly rebalancing announcements often signal sector rotations before they occur.
As India’s GDP growth outpaces major economies, this index remains the most efficient vehicle to participate in its expansion story.
FAQ
What is the Nifty 50 index?
The Nifty 50 is India’s benchmark stock market index, representing the performance of 50 large-cap companies listed on the National Stock Exchange (NSE). It reflects the overall health of the Indian economy.
How are companies selected for the Nifty 50?
Companies are chosen based on liquidity, free-float market capitalization, and sector representation. They must also meet trading frequency and impact cost criteria.
What does free-float market capitalization mean?
Free-float market cap refers to the total value of a company’s shares that are publicly traded and available for investors. It excludes locked-in shares held by promoters or governments.
How can international investors access the Nifty 50?
Global investors can trade through GIFT Nifty (formerly SGX Nifty) or invest in index funds and ETFs that track the index outside India.
What’s the difference between Nifty 50 and Sensex?
What sectors dominate the Nifty 50 index?
Financial services, IT, and energy sectors typically have the highest weightings. The exact breakdown changes quarterly based on market movements.
How often is the Nifty 50 rebalanced?
The index undergoes a full review every six months (March and September), with potential quarterly adjustments for corporate actions.
What derivatives products are available for Nifty 50?
Investors can trade futures, weekly options, monthly options, and long-term options on the index through the NSE derivatives market.
How has the Nifty 50 performed historically?
Since its 1996 launch, the index has delivered annualized returns around 12-14%, though with significant volatility during market crises like 2008 and 2020.
Can I invest directly in the Nifty 50 index?
While you can’t buy the index directly, you can invest through index funds, ETFs, or derivatives that track its performance.


